
How to Write an Effective Bench-Top EMC Pre-Compliance Test and Troubleshooting Report
- Jan 13
- 8 min read
Updated: Feb 4
A step-by-step guide to excellent engineering practice
Bench-top EMC pre-compliance testing is often carried out under time pressure, yet the quality of the test report directly determines how effective troubleshooting will be
Before committing to writing this article, I had two main thoughts:
First, I’ve seen far too many subpar test reports from engineers. They often do excellent work but aren’t given enough time to document it properly. As a result, when teams sit down to review the report weeks or even days later, important details are missing, and the test engineers have simply forgotten some of the more subtle points.
Second, I wondered if there might be a solid guideline for this online. A quick search on Google, to my surprise, didn’t turn up much on the subject.
These two reasons were enough to prompt me to write this article.
A quick note before we begin:This article won’t cover how to write an accredited EMC test report, which requires detailed documentation of things like test conditions, measurement uncertainty, and so on. Instead, it’s aimed at design engineers and test engineers who are doing hands-on work in their own labs. Of course, managers are more than welcome to read along too. And if you’re a manager who finds this article helpful, feel free to share it with your team.
To kick things off, let’s start by looking at an example of what not to do.

Figure 1 shows a screenshot from a test report I collected some time ago. Notice anything wrong?
First, there’s no setup picture. Anyone familiar with EMC/RF testing knows that even a minor setup error can lead to significantly different results. If a system is incorrectly tested as a fail, the result could lead to costly over-design. On the other hand, if a system is wrongly marked as a pass, finding out it fails at the accredited EMC lab will not only come as a surprise but will also add extra costs and delay your product’s time to market.
What else? The test conditions are not clearly defined. For example, what does the engineer mean by “extended the shield with extra foil”? It might have made sense at the time, but trust me—when the same engineer revisits the report a month later, they probably won’t remember the specifics. Moreover, we’d want to know if this “extra foil” was terminated and, if so, how. Unfortunately, no supporting photo was provided.
Lastly, the engineer made a statement without offering an explanation or supporting evidence. When stating “noise was common mode rather than differential mode,” there were no test results to back this up. In EMC/RF testing, assumptions are not enough. A simple RF current probe clamped on the cable bundle could have provided the necessary proof for this statement.
So, how should we write a high-quality test report? Based on years of troubleshooting and helping clients with their EMI issues, here is our step-by-step guide to writing an effective engineering report.
Step 1: Sharpening the Tools
Before diving into the setup, it's crucial to ensure your equipment is ready for the task—much like how a carpenter sharpens their tools before starting a project. While we’re not literally “sharpening” anything, the idea is the same: before any RF measurement, always check if your equipment is up to the job. Let me share an example to emphasize the importance of this step.
In one case, a client’s expensive receiver had a damaged RF front end, and they were unaware of it. This is a classic case of what I call “engineers’ bias”—the belief that high-priced equipment is inherently reliable. Engineers often place full confidence in costly instruments, but even these can fail. If your spectrum analyzer has a tracking generator, you can easily check for this issue. Simply connect the TG output and the spectrum input using a coaxial cable and perform a TG scan. One should see a flat, straight line across the whole frequency range at the supplied TG power level (often between -20 dBm and 0 dBm). This is shown in Figure 2.
The same principle applies to other test equipment. For instance, if an RF current probe is accidentally dropped, its transfer impedance may be affected. In such a case, you should recalibrate the probe before proceeding with the test. Likewise, LISNs should be regularly checked to ensure their impedance conforms to the relevant standards.
It's also important to document the last calibration, characterization, or inspection date for all equipment used in the test. If an incident occurs (like dropping the current probe), make sure to record it in the report. This guarantees traceability. While you can continue with the test, keep in mind that such events increase measurement uncertainty.

Step 2: Set-up
You must clearly show detailed photos of the test set-up. This should include an overall view of the test arrangement, as well as close-up shots of specific details, such as the bonding wire, how it’s bonded, and whether a continuity check was performed on the connections.
For conducted emissions/immunities and transient tests, include images showing the bonding of the test equipment, cable layout, and details of the DUT (Device Under Test) bonding, particularly if a bonding wire is used to connect to the test ground plane.
For radiated emissions tests (assuming you’re conducting them in your own lab—since radiated immunity testing can interfere with the electromagnetic environment, you should not perform radiated immunity test without a shielded tent), make sure to include pictures that show the antenna set-up.
Do we need to include a system diagram of the test set-up?
The short answer is: yes, preferably. While drawing a system diagram may take more time than simply snapping a photo, it’s still important to include a simple diagram. Popular tools for creating system diagrams include Microsoft Visio and PowerPoint. In Figure 3, I created the system diagram using Keynote on a MacBook. If you’re more artistically inclined, feel free to use other drawing tools—some engineers prefer this approach.

Figure 4 shows the actual test set-up I used for the conducted emission test (An overall view of the test arrangement). You can see I also listed the test equipment used for the test.

Other Key Information:
Your report should also include details about the power supply settings, such as voltage and current. If there’s any supporting equipment for the DUT, make sure to capture this in both the photos and the system diagram, and document the operational status in the report.
Environmental conditions such as room temperature and humidity are generally not required for in-house tests, but if you’re conducting ESD (Electrostatic Discharge) investigations, it’s important to document these factors, as humidity can affect the test results.
It is recommended to always test and measure ambient EM noise before starting any bench-top EMC test, and these results should be thoroughly documented in the test report. Typically, a bench-top power supply can introduce internal noise, which may be picked up by the LISN (Line Impedance Stabilization Network) during conducted emission tests.
Additionally, LED lights and nearby equipment often generate EM noise, which can easily couple to the DUT’s cable leads and impact the emission readings. When working without a shielded environment—which is often the case for design engineers testing and troubleshooting on the bench—the best practice is to benchmark the ambient noise. This can be done using the spectrum analyzer itself or by using software to save the ambient noise data for comparison in future studies.
Step 3: Obtaining Results
It’s always a good idea to save results directly from the equipment or through a connected computer (assuming the necessary software is installed), rather than relying on a photo of the screen. This approach offers several advantages:
Modern equipment software typically provides far more information than what’s visible on the screen, such as the date, time, and sampling rate (for an oscilloscope, for example). Additionally, saving data digitally avoids potential issues like reflections that may occur in photos.
Another benefit is that multiple traces can later be processed for comparison purposes. Some software even allows you to document extensive details, such as test conditions and operation modes, making the report more comprehensive and traceable.
An example is shown in Figure 5.

Step 4: Analyzing Results
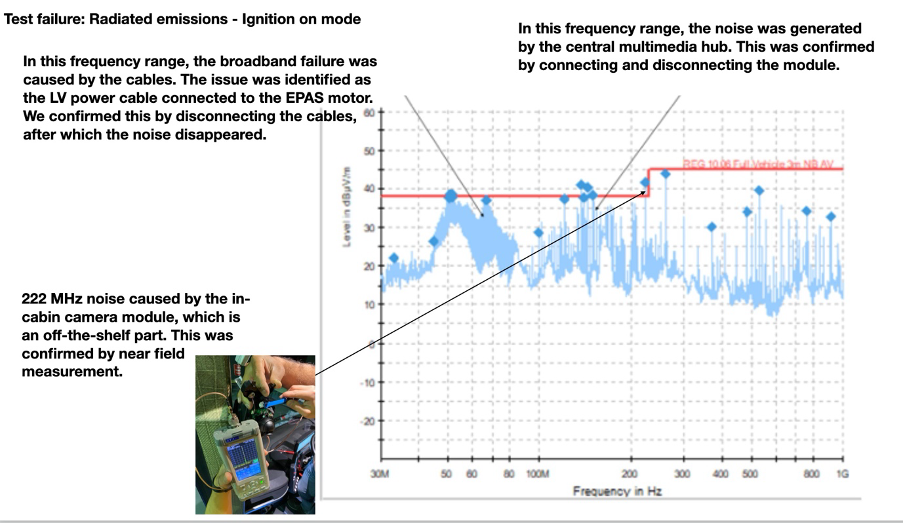
For a junior engineer, analyzing test results can seem daunting, but we encourage you to give it your best effort. To begin, focus on identifying the failure mode—sometimes it might be a resonance in the spectrum scan, or a narrowband signal failure. It’s important to provide some form of explanation. A good example is shown in Figure 6. In this radiated emission result, two issues are evident: first, there’s a broadband noise profile in the 50 to 80 MHz frequency range, and second, there are narrowband noise characteristics between 100 and 200 MHz. Additionally, a single narrowband spurious signal appears at 222 MHz. In this case, we highlighted these areas of interest and provided explanations for each. As always, if you suspect a specific culprit is causing the noise, prove it by providing further results—this significantly enhances the value of your analysis, as demonstrated here.
What if you don’t fully understand what’s happening? At the test stage, at the very least, offer a few potential explanations. You can say, “We believe it could be one of the following reasons,” and list some possibilities. You can also mention that further testing or simulation may be needed to pinpoint the root cause. This is important because when a team of engineers reviews the report together, other team members often contribute valuable insights and suggestions.
Step 5: Troubleshooting and Fixing
If the test report includes troubleshooting and fixes, the solutions must be clearly stated and supported with sufficient evidence. This should include photos, test results, and a clear rationale for the fix. For example, an engineer might say, “The power cable connected to the motor proved to be the main radiating mechanism, and a ferrite sleeve on the mains cable solved the problem.”
However, this approach is problematic for the reasons we’ve discussed earlier. A more effective statement would be:
“The motor power cable was identified as the main source of radiated emissions, as disconnecting the cable significantly reduced the noise between 50 and 80 MHz. We then applied XXX(part number) ferrite cores to the motor cable, placing it near the motor connector, and ensured the ferrite cores were close to the vehicle chassis (the location is crucial). As shown in Figure 7, this resulted in improved performance. See the comparison of the before and after results in Figure 7.”
By stating the troubleshooting results in this manner, you provide far more confidence in the solution.

Step 6: Summary & Conclusion
We believe a good report should also include suggestions, recommendations, or actions that need to be taken. Engineers may propose design changes, but it’s important to list the potential risks associated with those changes. This highlights that EMC engineering often involves compromise. While engineers may make solid suggestions, they must also consider other factors such as thermal or mechanical design, which might complicate implementation.
It’s also essential to consider alternative fixes. During troubleshooting, you are often limited by the tools at hand, and the solution you find may not be the most cost-effective. This is especially relevant for volume manufacturers, where even small cost differences can have a significant impact.
By this point, we’ve provided readers with a solid guide to writing a bench-top EMC test report. The principles outlined here are applicable across many areas of engineering. We welcome your suggestions and feedback.


Comments